-
Trupanion Reports Fourth Quarter & Full Year 2023 Results
来源: Nasdaq GlobeNewswire / 15 2月 2024 15:05:48 America/Chicago
SEATTLE, Feb. 15, 2024 (GLOBE NEWSWIRE) -- Trupanion, Inc. (Nasdaq: TRUP), the leading provider of medical insurance for cats and dogs, today announced financial results for the fourth quarter and full year ended December 31, 2023. The financial results are preliminary and subject to completion of the Company’s audit as described below.
“I am pleased that Q4 showed continued improvement in our financial metrics,” said Darryl Rawlings, CEO and Chair of the Board. “The combination of accelerated subscription revenue growth, continued margin expansion and efficient acquisition spend drove another quarter of positive free cash flow.”
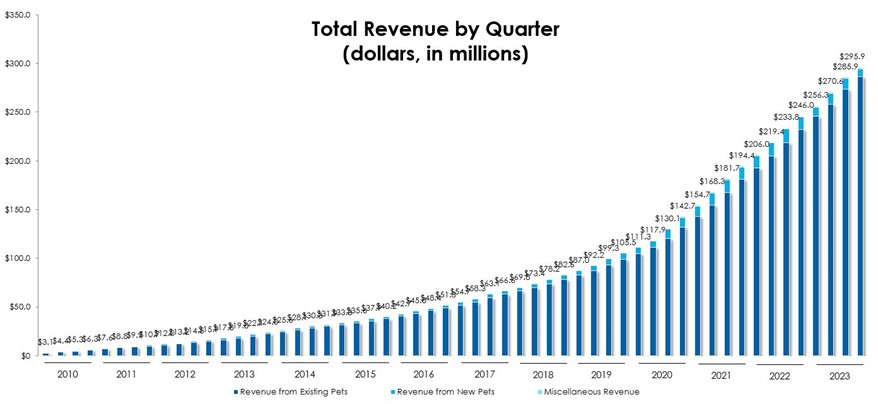
Fourth Quarter 2023 Financial and Business Highlights- Total revenue was $295.9 million, an increase of 20% compared to the fourth quarter of 2022.
- Total enrolled pets (including pets from our other business segment) was 1,714,473 at December 31, 2023, an increase of 12% over December 31, 2022.
- Subscription business revenue was $191.5 million, an increase of 21% compared to the fourth quarter of 2022.
- Subscription enrolled pets was 991,426 at December 31, 2023, an increase of 14% over December 31, 2022.
- Net loss was $(2.2) million, or $(0.05) per basic and diluted share, compared to net loss of $(9.3) million, or $(0.23) per basic and diluted share, in the fourth quarter of 2022.
- Adjusted EBITDA was $8.5 million, compared to adjusted EBITDA of $2.2 million in the fourth quarter of 2022.
- Operating cash flow was $17.5 million and free cash flow was $13.5 million in the fourth quarter of 2023. This compared to operating cash flow of $1.0 million and free cash flow of $(4.5) million in the fourth quarter of 2022.
Full Year 2023 Financial and Business Highlights
- Total revenue was $1.1 billion, an increase of 22% compared to 2022.
- Subscription business revenue was $712.9 million, an increase of 19% compared to 2022.
- Net loss was $(44.7) million, or $(1.08) per basic and diluted share, compared to net loss of $(44.7) million, or $(1.10) per basic and diluted share, in 2022.
- Adjusted EBITDA was $6.4 million, compared to adjusted EBITDA of $0.7 million in 2022.
- Operating cash flow was $18.6 million and free cash flow was $0.4 million in 2023. This compared to operating cash flow of $(8.0) million and free cash flow of $(25.1) million in 2022.
- At December 31, 2023, the Company held $277.2 million in cash and short-term investments, including $46.6 million held outside the insurance entities, with an additional $15 million available under its credit facility.
- The Company maintained $241.3 million of capital surplus at its insurance subsidiaries. This was $64.1 million more than the estimated risk-based capital requirement of $177.2 million.
Annual Report on Form 10-K
While the Company is still completing its assessment of the effectiveness of its internal controls over financial reporting in its upcoming fiscal 2023 Annual Report on Form 10-K, the Company expects to report two material weaknesses in internal controls. The first material weakness relates to information technology controls, primarily in the areas of user access and program change-management over certain information technology systems.The second material weakness relates to internal controls over financial reporting, pertaining to the Company’s Other Business segment. The 2023 audit remains open, and the Company is working with its auditors to complete the process. As a result, the Company’s financial results for the fourth quarter and full year 2023 are preliminary and subject to the completion of the audit. Efforts to remediate these material weaknesses are underway. The Company expects to provide additional details about the material weaknesses, including its remediation efforts, in its Annual Report on Form 10-K.
Conference Call
Trupanion’s management will host a conference call today to review its fourth quarter and full year 2023 results. The call is scheduled to begin shortly after 1:30 p.m. PT/ 4:30 p.m. ET. A live webcast will be accessible through the Investor Relations section of Trupanion’s website at https://investors.trupanion.com/ and will be archived online for 3 months upon completion of the conference call. Participants can access the conference call by dialing 1-877-300-8521 (United States) or 1-412-317-6026 (International). A telephonic replay of the call will also be available after the completion of the call, by dialing 1-844-512-2921 (United States) or 1-412-317-6671 (International) and entering the replay pin number: 10182458.About Trupanion
Trupanion is a leader in medical insurance for cats and dogs throughout the United States, Canada, Europe, Puerto Rico and Australia with over 990,000 pets enrolled. For over two decades, Trupanion has given pet owners peace of mind so they can focus on their pet's recovery, not financial stress. Trupanion is committed to providing pet owners with the highest value in pet medical insurance with unlimited payouts for the life of their pets. With its patented process, Trupanion is the only North American provider with the technology to pay veterinarians directly in seconds at the time of checkout. Trupanion is listed on NASDAQ under the symbol "TRUP". The company was founded in 2000 and is headquartered in Seattle, WA. Trupanion policies are issued, in the United States, by its wholly-owned insurance entity American Pet Insurance Company and, in Canada, by Omega General Insurance Company. Trupanion Australia is a partnership between Trupanion and Hollard Insurance Company. For more information, please visit trupanion.com.Forward-Looking Statements
This press release contains forward-looking statements within the meaning of Section 27A of the Securities Act of 1933 and Section 21E of the Securities Exchange Act of 1934 relating to, among other things, expectations, plans, prospects and financial results for Trupanion, including, but not limited to, its expectations regarding its ability to continue to grow its enrollments and revenue, its ability to remediate the material weaknesses in internal control over financial reporting and the timing thereof, its’ ability to complete its 2023 annual audit and timely file its Form 10-K, and otherwise execute its business plan. These forward-looking statements are based upon the current expectations and beliefs of Trupanion’s management as of the date of this press release, and are subject to certain risks and uncertainties that could cause actual results to differ materially from those described in the forward-looking statements. All forward-looking statements made in this press release are based on information available to Trupanion as of the date hereof, and Trupanion has no obligation to update these forward-looking statements.In particular, the following factors, among others, could cause results to differ materially from those expressed or implied by such forward-looking statements: the ability to achieve or maintain profitability and/or appropriate levels of cash flow in future periods; the ability to keep growing our membership base and revenue; the accuracy of assumptions used in determining appropriate member acquisition expenditures; the severity and frequency of claims; the ability to maintain high retention rates; the accuracy of assumptions used in pricing medical plan subscriptions and the ability to accurately estimate the impact of new products or offerings on claims frequency; actual claims expense exceeding estimates; regulatory and other constraints on the ability to institute, or the decision to otherwise delay, pricing modifications in response to changes in actual or estimated claims expense; the effectiveness and statutory or regulatory compliance of our Territory Partner model and of our Territory Partners, veterinarians and other third parties in recommending medical plan subscriptions to potential members; the ability to retain existing Territory Partners and increase the number of Territory Partners and active hospitals; compliance by us and those referring us members with laws and regulations that apply to our business, including the sale of a pet medical plan; the ability to maintain the security of our data; fluctuations in the Canadian currency exchange rate; the ability to protect our proprietary and member information; the ability to maintain our culture and team; the ability to maintain the requisite amount of risk-based capital; our ability to implement and maintain effective controls, including to remediate material weaknesses in internal controls over financial reporting; the ability to complete its 2023 annual audit and timely file its Form 10-K, the ability to protect and enforce Trupanion’s intellectual property rights; the ability to successfully implement our alliance with Aflac; the ability to continue key contractual relationships with third parties; third-party claims including litigation and regulatory actions; the ability to recognize benefits from investments in new solutions and enhancements to Trupanion’s technology platform and website; and our ability to retain key personnel.
For a detailed discussion of these and other cautionary statements, please refer to the risk factors discussed in filings with the Securities and Exchange Commission (SEC), including but not limited to Trupanion’s Annual Report on Form 10-K for the year ended December 31, 2022 and any subsequently filed reports on Forms 10-Q, 10-K and 8-K. All documents are available through the SEC’s Electronic Data Gathering Analysis and Retrieval system at https://www.sec.gov or the Investor Relations section of Trupanion’s website at https://investors.trupanion.com.
Non-GAAP Financial Measures
Trupanion’s stated results may include certain non-GAAP financial measures. These non-GAAP financial measures may not provide information that is directly comparable to that provided by other companies in its industry as other companies in its industry may calculate or use non-GAAP financial measures differently. In addition, there are limitations in using non-GAAP financial measures because the non-GAAP financial measures are not prepared in accordance with GAAP, may be different from non-GAAP financial measures used by other companies and exclude expenses that may have a material impact on Trupanion’s reported financial results. The presentation and utilization of non-GAAP financial measures is not meant to be considered in isolation or as a substitute for the directly comparable financial measures prepared in accordance with GAAP. Trupanion urges its investors to review the reconciliation of its non-GAAP financial measures to the most directly comparable GAAP financial measures in its consolidated financial statements, and not to rely on any single financial or operating measure to evaluate its business. These reconciliations are included below and on Trupanion’s Investor Relations website.Because of varying available valuation methodologies, subjective assumptions and the variety of equity instruments that can impact a company’s non-cash expenses, Trupanion believes that providing various non-GAAP financial measures that exclude stock-based compensation expense and depreciation and amortization expense allows for more meaningful comparisons between its operating results from period to period. Trupanion offsets new pet acquisition expense with sign-up fee revenue in the calculation of net acquisition cost because it collects sign-up fee revenue from new members at the time of enrollment and considers it to be an offset to a portion of Trupanion’s new pet acquisition expense. Trupanion believes this allows it to calculate and present financial measures in a consistent manner across periods. Trupanion’s management believes that the non-GAAP financial measures and the related financial measures derived from them are important tools for financial and operational decision-making and for evaluating operating results over different periods of time.
Trupanion, Inc.
Consolidated Statements of Operations
(in thousands, except share data)Three Months Ended December 31, Year Ended December 31, 2023 2022 2023 2022 (unaudited) (unaudited) Revenue: Subscription business $ 191,537 $ 158,562 $ 712,906 $ 596,610 Other business 104,320 87,447 395,699 308,569 Total revenue 295,857 246,009 1,108,605 905,179 Cost of revenue: Subscription business(1) 158,631 131,823 613,686 497,684 Other business 97,162 80,537 363,903 285,310 Total cost of revenue(2) 255,793 212,360 977,589 782,994 Operating expenses: Technology and development(1) 5,969 6,955 21,403 25,133 General and administrative(1) 13,390 10,472 60,207 39,379 New pet acquisition expense(1) 17,189 22,457 77,372 89,500 Depreciation and amortization 3,029 2,897 12,474 10,921 Total operating expenses 39,577 42,781 171,456 164,933 Gain (loss) from investment in joint venture (79 ) (85 ) (219 ) (253 ) Operating loss 408 (9,217 ) (40,659 ) (43,001 ) Interest expense 3,697 1,587 12,077 4,267 Other income, net (1,256 ) (1,504 ) (7,701 ) (3,072 ) Loss before income taxes (2,033 ) (9,300 ) (45,035 ) (44,196 ) Income tax expense (benefit) 130 (15 ) (342 ) 476 Net loss $ (2,163 ) $ (9,285 ) $ (44,693 ) $ (44,672 ) Net loss per share: Basic and diluted $ (0.05 ) $ (0.23 ) $ (1.08 ) $ (1.10 ) Weighted average shares of common stock outstanding: Basic and diluted 41,716,527 40,936,507 41,436,882 40,765,355 (1)Includes stock-based compensation expense as follows: Three Months Ended December 31, Year Ended December 31, 2023 2022 2023 2022 Cost of revenue $ 1,478 $ 1,346 $ 5,279 $ 6,484 Technology and development 861 1,549 2,846 4,742 General and administrative 3,269 3,550 17,717 12,831 New pet acquisition expense 1,693 2,122 7,319 9,336 Total stock-based compensation expense $ 7,301 $ 8,567 $ 33,161 $ 33,393 (2)The breakout of cost of revenue between veterinary invoice expense and other cost of revenue is as follows: Three Months Ended December 31, Year Ended December 31, 2023 2022 2023 2022 Veterinary invoice expense $ 217,739 $ 176,083 $ 831,055 $ 649,737 Other cost of revenue 38,054 36,277 146,534 133,257 Total cost of revenue $ 255,793 $ 212,360 $ 977,589 $ 782,994 Trupanion, Inc.
Consolidated Balance Sheets
(in thousands, except share data)December 31, 2023 December 31, 2022 (unaudited) Assets Current assets: Cash and cash equivalents $ 147,501 $ 65,605 Short-term investments 129,667 156,804 Accounts and other receivables, net of allowance for doubtful accounts of $1,085 at December 31, 2023 and $540 at December 31, 2022 267,899 232,439 Prepaid expenses and other assets 17,022 14,248 Total current assets 562,089 469,096 Restricted cash 22,963 19,032 Long-term investments 12,866 7,841 Property, equipment and internal-use software, net 103,650 90,701 Intangible assets, net 18,745 24,031 Other long-term assets 18,922 18,943 Goodwill 43,713 41,983 Total assets $ 782,948 $ 671,627 Liabilities and stockholders’ equity Current liabilities: Accounts payable $ 10,505 $ 9,471 Accrued liabilities and other current liabilities 34,052 32,616 Reserve for veterinary invoices 63,238 43,734 Deferred revenue 235,329 202,692 Long-term debt - current portion 1,350 1,103 Total current liabilities 344,474 289,616 Long-term debt 127,580 68,354 Deferred tax liabilities 2,685 3,392 Other liabilities 4,487 4,968 Total liabilities 479,226 366,330 Stockholders’ equity: Common stock: $0.00001 par value per share, 100,000,000 shares authorized; 42,887,052 and 41,858,866 issued and outstanding at December 31, 2023; 42,041,344 and 41,013,158 shares issued and outstanding at December 31, 2022 — — Preferred stock: $0.00001 par value per share, 10,000,000 shares authorized; no shares issued and outstanding — — Additional paid-in capital 536,108 499,694 Accumulated other comprehensive loss 403 (6,301 ) Accumulated deficit (216,255 ) (171,562 ) Treasury stock, at cost: 1,028,186 shares at December 31, 2023 and December 31, 2022 (16,534 ) (16,534 ) Total stockholders’ equity 303,722 305,297 Total liabilities and stockholders’ equity $ 782,948 $ 671,627 Trupanion, Inc.
Consolidated Statements of Cash Flows
(in thousands)Three Months Ended December 31, Year Ended December 31, 2023 2022 2023 2022 (unaudited) (unaudited) Operating activities Net loss $ (2,163 ) $ (9,285 ) $ (44,693 ) $ (44,672 ) Adjustments to reconcile net loss to cash provided by (used in) operating activities: Depreciation and amortization 3,029 2,897 12,474 10,921 Stock-based compensation expense 7,301 8,567 33,161 33,393 Other, net 2,481 1,023 1,347 1,051 Changes in operating assets and liabilities: Accounts and other receivables 10,153 (8,034 ) (35,440 ) (66,982 ) Prepaid expenses and other assets 854 (807 ) (1,907 ) (5,227 ) Accounts payable, accrued liabilities, and other liabilities 5,476 2,388 1,644 3,136 Reserve for veterinary invoices 1,788 4,164 19,485 4,227 Deferred revenue (11,412 ) 106 32,567 56,153 Net cash provided by (used in) operating activities 17,507 1,019 18,638 (8,000 ) Investing activities Purchases of investment securities (56,547 ) (147,346 ) (165,936 ) (273,006 ) Maturities and sales of investment securities 42,905 134,718 190,270 239,210 Cash paid in business acquisition, net of cash acquired — (12,279 ) — (15,034 ) Purchases of property, equipment, and internal-use software (3,970 ) (5,478 ) (18,280 ) (17,088 ) Other 165 (167 ) 1,585 (1,598 ) Net cash provided by (used in) investing activities (17,447 ) (30,552 ) 7,639 (67,516 ) Financing activities Proceeds from debt financing, net of financing fees — 14,826 60,102 69,138 Repayment of debt financing (337 ) (271 ) (1,717 ) (571 ) Repurchases of common stock — — — (5,755 ) Proceeds from exercise of stock options 1,374 706 2,655 2,290 Shares withheld to satisfy tax withholding (240 ) (579 ) (1,536 ) (4,359 ) Other (228 ) — (378 ) — Net cash provided by (used in) financing activities 569 14,682 59,126 60,743 Effect of foreign exchange rate changes on cash, cash equivalents, and restricted cash, net 1,254 505 424 (1,459 ) Net change in cash, cash equivalents, and restricted cash 1,883 (14,346 ) 85,827 (16,232 ) Cash, cash equivalents, and restricted cash at beginning of period 168,581 98,983 84,637 100,869 Cash, cash equivalents, and restricted cash at end of period $ 170,464 $ 84,637 $ 170,464 $ 84,637 The following tables set forth our key operating metrics: Year Ended
December 31,2023 2022 Total Business: Total pets enrolled (at period end) 1,714,473 1,537,573 Subscription Business: Total subscription pets enrolled (at period end) 991,426 869,862 Monthly average revenue per pet $ 65.26 $ 63.82 Lifetime value of a pet, including fixed expenses $ 419 $ 641 Average pet acquisition cost (PAC) $ 228 $ 289 Average monthly retention 98.49 % 98.69 % Three Months Ended Dec. 31,
2023Sep. 30,
2023Jun. 30,
2023Mar. 31,
2023Dec. 31,
2022Sep. 30,
2022Jun. 30,
2022Mar. 31,
2022Total Business: Total pets enrolled (at period end) 1,714,473 1,712,177 1,679,659 1,616,865 1,537,573 1,439,605 1,348,145 1,267,253 Subscription Business: Total subscription pets enrolled (at period end) 991,426 969,322 943,958 906,369 869,862 808,077 770,318 736,691 Monthly average revenue per pet $ 67.07 $ 65.82 $ 64.41 $ 63.58 $ 63.11 $ 63.80 $ 64.26 $ 64.21 Lifetime value of a pet, including fixed expenses $ 419 $ 428 $ 470 $ 541 $ 641 $ 673 $ 713 $ 730 Average pet acquisition cost (PAC) $ 217 $ 212 $ 236 $ 247 $ 283 $ 268 $ 309 $ 301 Average monthly retention 98.49 % 98.55 % 98.61 % 98.65 % 98.69 % 98.71 % 98.74 % 98.75 % The following table reflects the reconciliation of cash provided by operating activities to free cash flow (in thousands): Three Months Ended December 31, Year Ended December 31, 2023 2022 2023 2022 Net cash provided by (used in) operating activities $ 17,507 $ 1,019 $ 18,638 $ (8,000 ) Purchases of property, equipment, and internal-use software (3,970 ) (5,478 ) (18,280 ) (17,088 ) Free cash flow $ 13,537 $ (4,459 ) $ 358 $ (25,088 ) The following tables reflect the reconciliation between GAAP and non-GAAP measures (in thousands except percentages): Three Months Ended December 31, Year Ended December 31, 2023 2022 2023 2022 Veterinary invoice expense $ 217,739 $ 176,083 $ 831,055 $ 649,737 Less: Stock-based compensation expense1 (885 ) (899 ) (3,450 ) (4,054 ) Other business cost of paying veterinary invoices (77,572 ) (59,946 ) (287,858 ) (212,857 ) Subscription cost of paying veterinary invoices (non-GAAP) $ 139,282 $ 115,238 $ 539,747 $ 432,826 % of subscription revenue 72.7 % 72.7 % 75.7 % 72.5 % Other cost of revenue $ 38,054 $ 36,277 $ 146,534 $ 133,257 Less: Stock-based compensation expense1 (386 ) (414 ) (1,544 ) (2,232 ) Other business variable expenses (19,301 ) (20,591 ) (75,756 ) (72,453 ) Subscription variable expenses (non-GAAP) $ 18,367 $ 15,272 $ 69,234 $ 58,572 % of subscription revenue 9.6 % 9.6 % 9.7 % 9.8 % Technology and development expense $ 5,969 $ 6,955 $ 21,403 $ 25,133 General and administrative expense 13,390 10,472 60,207 39,379 Less: Stock-based compensation expense1 (3,797 ) (5,019 ) (19,869 ) (17,135 ) Non-recurring transaction or restructuring expenses2 — (193 ) (4,175 ) (372 ) Development expenses3 (1,683 ) (2,084 ) (5,100 ) (7,789 ) Fixed expenses (non-GAAP) $ 13,879 $ 10,131 $ 52,466 $ 39,216 % of total revenue 4.7 % 4.1 % 4.7 % 4.3 % New pet acquisition expense $ 17,189 $ 22,457 $ 77,372 $ 89,500 Less: Stock-based compensation expense1 (1,567 ) (2,079 ) (7,000 ) (9,116 ) Other business pet acquisition expense (77 ) (65 ) (200 ) (541 ) Subscription acquisition cost (non-GAAP) $ 15,545 $ 20,313 $ 70,172 $ 79,843 % of subscription revenue 8.1 % 12.8 % 9.8 % 13.4 % 1Trupanion employees may elect to take restricted stock units in lieu of cash payment for their bonuses. We account for such expense as stock-based compensation according to GAAP, but we do not include it in any non-GAAP adjustments. Stock-based compensation associated with bonuses was approximately $0.7 million and $1.3 million for the three months and year ended December 31, 2023, respectively. 2Consists of business acquisition transaction expenses, severance and legal costs due to certain executives' departures, and a $3.8 million non-recurring settlement of accounts receivable in the first quarter of 2023 related to uncollected premiums in connection with the transition of underwriting a third-party business to other insurers. 3As we enter the next phase of our growth, we expect to invest in initiatives that are pre-revenue, including adding new products and international expansion. These development expenses are costs related to product exploration and development that are pre-revenue and historically have been insignificant. We view these activities as uses of our adjusted operating income separate from pet acquisition spend. The following tables reflect the reconciliation of GAAP measures to non-GAAP measures (in thousands, except percentages): Three Months Ended December 31, Year Ended December 31, 2023 2022 2023 2022 Operating Income, GAAP Basis $ 408 $ (9,217 ) $ (40,659 ) $ (43,001 ) Non-GAAP Expense adjustments Acquisition cost 15,622 20,378 70,372 80,384 Stock-based compensation expense1 6,636 8,411 31,864 32,537 Development expenses3 1,683 2,084 5,100 7,789 Depreciation and amortization 3,029 2,897 12,474 10,921 Non-recurring transaction or restructuring expenses2 — 193 4,175 372 Gain (loss) from investment in joint venture (79 ) (85 ) (219 ) (253 ) Total Adjusted Operating income $ 27,457 $ 24,831 $ 83,545 $ 89,255 Subscription Business: Subscription Operating Income, GAAP Basis $ 1,300 $ (8,753 ) $ (35,994 ) $ (39,757 ) Non-GAAP Expense adjustments Acquisition cost 15,545 20,313 70,172 79,843 Stock-based compensation expense1 5,006 6,628 24,488 26,673 Development expenses3 1,090 1,343 3,281 5,123 Depreciation and amortization 1,961 1,867 8,021 7,205 Non-recurring transaction or restructuring expenses2 — 124 218 241 Subscription Adjusted Operating income $ 24,902 $ 21,522 $ 70,186 $ 79,328 Other Business: Other Business Operating Income, GAAP Basis $ (813 ) $ (379 ) $ (4,446 ) $ (2,992 ) Non-GAAP Expense adjustments Acquisition cost 77 65 200 541 Stock-based compensation expense1 1,630 1,783 7,376 5,865 Development expenses3 593 741 1,819 2,666 Depreciation and amortization 1,068 1,030 4,453 3,716 Non-recurring transaction or restructuring expenses2 — 69 3,957 131 Other Business Adjusted Operating income $ 2,555 $ 3,309 $ 13,359 $ 9,927 1Trupanion employees may elect to take restricted stock units in lieu of cash payment for their bonuses. We account for such expense as stock-based compensation according to GAAP, but we do not include it in any non-GAAP adjustments. Stock-based compensation associated with bonuses was approximately $0.7 million and $1.3 million for the three months and year ended December 31, 2023, respectively. 2Consists of business acquisition transaction expenses, severance and legal costs due to certain executives' departures, and a $3.8 million non-recurring settlement of accounts receivable in the first quarter of 2023 related to uncollected premiums in connection with the transition of underwriting a third-party business to other insurers. 3As we enter the next phase of our growth, we expect to invest in initiatives that are pre-revenue, including adding new products and international expansion. These development expenses are costs related to product exploration and development that are pre-revenue and historically have been insignificant. We view these activities as uses of our adjusted operating income separate from pet acquisition spend. The following tables reflect the reconciliation of GAAP measures to non-GAAP measures (in thousands, except percentages): Three Months Ended December 31, Year Ended December 31, 2023 2022 2023 2022 Subscription revenue $ 191,537 $ 158,562 $ 712,906 $ 596,610 Subscription cost of paying veterinary invoices 139,281 115,238 539,746 432,826 Subscription variable expenses 18,367 15,272 69,234 58,572 Subscription fixed expenses* 8,987 6,530 33,740 25,884 Subscription adjusted operating income $ 24,902 $ 21,522 $ 70,186 $ 79,328 Other business revenue $ 104,320 $ 87,447 $ 395,699 $ 308,569 Other business cost of paying veterinary invoices 77,572 59,946 287,858 212,857 Other business variable expenses 19,301 20,591 75,756 72,453 Other business fixed expenses* 4,892 3,601 18,726 13,332 Other business adjusted operating income $ 2,555 $ 3,309 $ 13,359 $ 9,927 Revenue $ 295,857 $ 246,009 $ 1,108,605 $ 905,179 Cost of paying veterinary invoices 216,854 175,184 827,605 645,683 Variable expenses 37,668 35,863 144,990 131,025 Fixed expenses* 13,879 10,131 52,466 39,216 Total business adjusted operating income $ 27,457 $ 24,831 $ 83,545 $ 89,255 As a percentage of revenue: Three Months Ended December 31, Year Ended December 31, 2023 2022 2023 2022 Subscription revenue 100.0 % 100.0 % 100.0 % 100.0 % Subscription cost of paying veterinary invoices 72.7 % 72.7 % 75.7 % 72.5 % Subscription variable expenses 9.6 % 9.6 % 9.7 % 9.8 % Subscription fixed expenses* 4.7 % 4.1 % 4.7 % 4.3 % Subscription adjusted operating income 13.0 % 13.6 % 9.8 % 13.3 % Other business revenue 100.0 % 100.0 % 100.0 % 100.0 % Other business cost of paying veterinary invoices 74.4 % 68.6 % 72.7 % 69.0 % Other business variable expenses 18.5 % 23.5 % 19.1 % 23.5 % Other business fixed expenses* 4.7 % 4.1 % 4.7 % 4.3 % Other business adjusted operating income 2.4 % 3.8 % 3.4 % 3.2 % Revenue 100.0 % 100.0 % 100.0 % 100.0 % Cost of paying veterinary invoices 73.3 % 71.2 % 74.7 % 71.3 % Variable expenses 12.7 % 14.6 % 13.1 % 14.5 % Fixed expenses* 4.7 % 4.1 % 4.7 % 4.3 % Total adjusted operating income 9.3 % 10.1 % 7.5 % 9.9 %
*Fixed expenses represent shared services that support both our subscription and other business segments and, as such, are generally allocated to each segment pro-rata based on revenues.Adjusted operating income is a non-GAAP financial measure that adjusts operating income (loss) to remove the effect of acquisition cost, development expenses, non-recurring transaction or restructuring expenses, and gain (loss) from investment in joint venture. Non-cash items, such as stock-based compensation expense and depreciation and amortization, are also excluded. Acquisition cost, development expenses, gain (loss) from investment in joint venture, stock-based compensation expense, and depreciation and amortization are expected to remain recurring expenses for the foreseeable future, but are excluded from this metric to measure scale in other areas of the business. Management believes acquisition costs primarily represent the cost to acquire new subscribers and are driven by the amount of growth we choose to pursue based primarily on the amount of our adjusted operating income period over period. Accordingly, this measure is not indicative of our core operating income performance. We also exclude development expenses, gain (loss) from investment in joint venture, stock-based compensation expense, and depreciation and amortization because some investors may not view those items as reflective of our core operating income performance.
Management uses adjusted operating income and the margin on adjusted operating income to understand the effects of scale in its non-acquisition cost and development expenses and to plan future advertising expenditures, which are designed to acquire new pets. Management uses this measure as a principal way of understanding the operating performance of its business exclusive of acquisition cost and new product exploration and development initiatives. Management believes disclosure of this metric provides investors with the same data that the Company employs in assessing its overall operations and that disclosure of this measure may provide useful information regarding the efficiency of our utilization of revenues, return on advertising dollars in the form of new subscribers and future use of available cash to support the continued growth of our business.
The following tables reflect the reconciliation of adjusted EBITDA to net loss (in thousands): Year Ended December 31, 2023 2022 Net loss $ (44,693 ) $ (44,672 ) Excluding: Stock-based compensation expense 31,864 32,537 Depreciation and amortization expense 12,474 10,921 Interest income (9,011 ) (3,026 ) Interest expense 12,077 4,267 Other non-operating expenses — (1 ) Income tax (benefit) expense (342 ) 476 Non-recurring transaction or restructuring expenses 4,175 372 (Gain) loss from equity method investment (110 ) (131 ) Adjusted EBITDA $ 6,434 $ 743 Three Months Ended Dec. 31, 2023 Sep. 30, 2023 Jun. 30, 2023 Mar. 31, 2023 Dec. 31, 2022 Sep. 30, 2022 Jun. 30, 2022 Mar. 31, 2022 Net loss $ (2,163 ) $ (4,036 ) $ (13,714 ) $ (24,780 ) $ (9,285 ) $ (12,914 ) $ (13,618 ) $ (8,855 ) Excluding: Stock-based compensation expense 6,636 6,585 6,503 12,140 8,412 8,306 8,462 7,358 Depreciation and amortization expense 3,029 2,990 3,253 3,202 2,897 2,600 2,707 2,717 Interest income (2,842 ) (2,389 ) (2,051 ) (1,729 ) (1,614 ) (1,018 ) (297 ) (97 ) Interest expense 3,697 3,053 2,940 2,387 1,587 1,408 1,193 79 Other non-operating expenses — — — — — — (1 ) — Income tax expense (benefit) 130 (43 ) (238 ) (191 ) (15 ) 496 19 (24 ) Non-recurring transaction or restructuring expenses — 8 65 4,102 193 179 — — (Gain) loss from equity method investment — (110 ) — — — — (131 ) — Adjusted EBITDA $ 8,487 $ 6,058 $ (3,242 ) $ (4,869 ) $ 2,175 $ (943 ) $ (1,666 ) $ 1,178 Contacts:
Investors:
Laura Bainbridge
Senior Vice President, Corporate Communications
Investor.Relations@trupanion.comA photo accompanying this announcement is available at https://www.globenewswire.com/NewsRoom/AttachmentNg/43ac6979-0a60-4a85-be2c-e575f1305fdf


Trupanion, Inc.
Total Revenue by Quarter